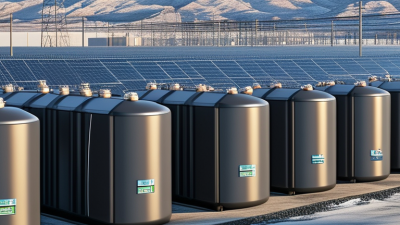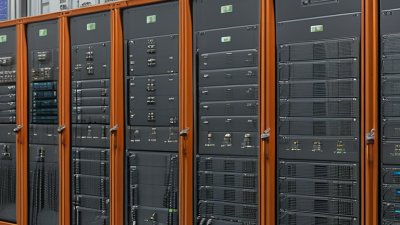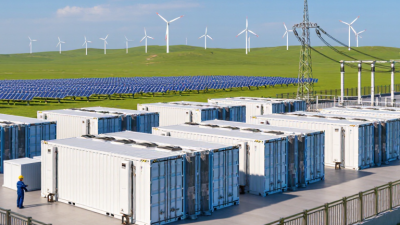
China is a major sourcing market for battery energy storage systems, serving projects that range from factory backup to utility-scale storage. Its manufacturers offer integrated equipment as well as individual components, including battery racks, battery management systems, power conversion systems, and thermal controls. The product may look like a row of steel cabinets or a container beside a substation. Yet performance depends on how these parts work together.
This guide to China’s top battery energy storage system manufacturers focuses on practical ways to compare suppliers. Buyers should examine system design, documented testing, production capabilities, warranty terms, and support after installation. Ask how the manufacturer manages temperature, monitors cell condition, and handles service requests. Details matter. A polished brochure cannot replace a clear test report or a factory audit. Specifications also need context: cycle-life figures, for example, depend on operating conditions and should not be compared without checking the test method.
No supplier is perfect. Project requirements differ, and a strong fit for one site may be a poor fit for another. Product availability, certifications, and service coverage can also vary by model and destination. Verify current documents directly with each manufacturer, and have technical claims reviewed by qualified project professionals. This article provides a starting point, not a substitute for due diligence. The most useful shortlist is built around transparent evidence, realistic operating needs, and dependable support—not rankings alone.
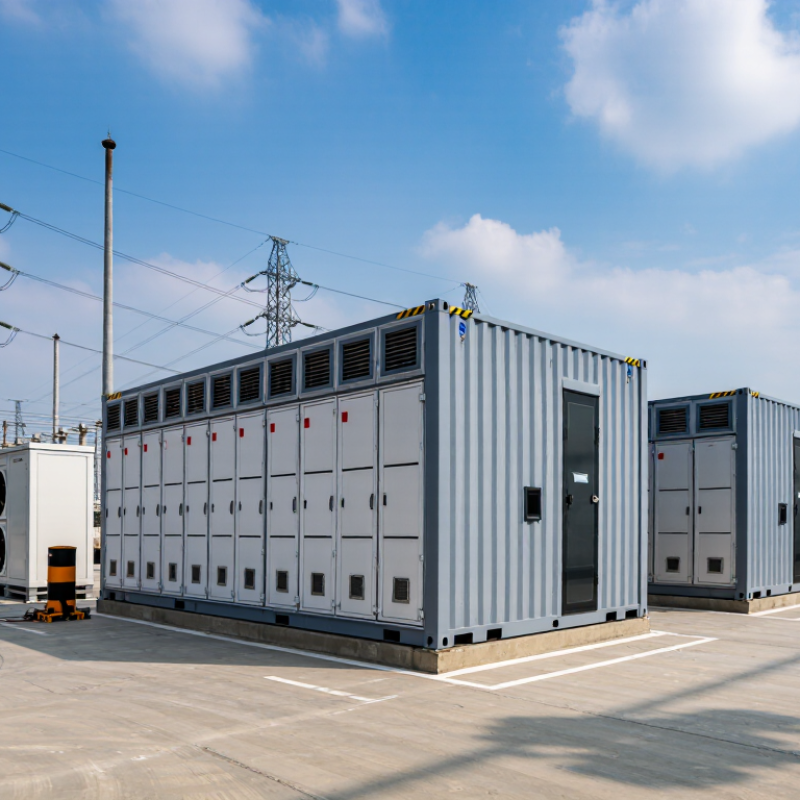
A battery energy storage system (BESS) stores electricity in batteries and releases it when demand rises or renewable output changes. It is more than a row of battery racks. A complete system combines battery cells, power electronics, controls, cooling, and protective equipment. During a site inspection, cable routing and airflow can matter as much as the system’s rated capacity.
Battery modules contain cells, and racks group modules into serviceable units. A battery management system monitors voltage, current, and temperature, then limits operation when readings move outside safe ranges. The power conversion system changes battery output from direct current to grid-compatible alternating current, and reverses the process during charging. An energy management controller schedules charging and discharge to suit site needs. Its decisions depend on good data, though forecasts are not always right.
Cooling equipment removes heat, while sensors and fire detection help identify abnormal conditions. Enclosures also need suitable ventilation, access space, and protection from local weather. Design choices vary with battery chemistry, climate, power rating, and installation setting.
Small oversight, big consequence.
A dashboard may show healthy averages while one connection runs hot, so inspections and trend reviews remain important. Even a carefully designed BESS cannot eliminate uncertainty; battery aging and changing site loads deserve honest attention.
China added 22.6 GW of new energy storage capacity in 2023, alongside 48.7 GWh of energy capacity. Dividing the figures gives an average duration of about 2.15 hours. That points to a market expanding quickly, with many projects designed to shift electricity across short periods rather than cover long outages. The numbers are significant, but they describe installed additions, not how often systems were dispatched or how reliably they performed.
For manufacturers, this growth raises practical demands: battery modules, thermal management, power conversion, and controls must work together under real operating conditions. A container beside a solar farm may face hot afternoons, dust, and frequent cycling. Small design choices matter. Yet national totals can hide differences in project quality, connection delays, and local grid needs. Capacity alone does not prove value. Buyers and planners should compare usable energy, round-trip efficiency, safety testing, and expected service life, while checking how figures are defined. That is not always simple. The 2023 additions show scale; they do not, by themselves, reveal which systems delivered the strongest results.
China’s leading battery energy storage manufacturers compete through cell production, system integration, and project delivery. CNESA’s 2024 white paper reported 21.5 GW and 46.6 GWh of newly installed Chinese “new-type” energy storage in 2023. That scale matters. Large factories can support volume, but buyers still need to check cell consistency, thermal controls, and service capacity. A polished product sheet is not field evidence.
The IEA reported that global battery storage additions in the power sector rose 130% in 2023, reaching 42 GW. Chinese suppliers serve this expanding market with battery containers, power conversion equipment, and monitoring software. No supplier fits every grid. A useful comparison examines round-trip efficiency, degradation guarantees, fire-safety design, and spare-parts access under local conditions. Ask for operating data from projects with similar climates and duty cycles. Hot afternoons and repeated cycling expose weaknesses that a short factory visit may miss. Even strong specifications deserve scrutiny: warranty exclusions and commissioning support can matter as much as headline capacity.
Year-end operational power capacity, 2021–2024
China’s operational new-type energy storage capacity expanded rapidly, reaching 73.76 GW by the end of 2024. These figures describe the national market, not individual manufacturers. Sources: China National Energy Administration and China Energy Storage Alliance; figures reflect published year-end reports.
China’s 2023 average battery energy storage duration of 2.1 hours is a useful reference, not a design rule. A two-hour system can shift evening demand when charging schedules and grid conditions align. Yet duration alone does not show how much energy is available at the required time. Engineers also assess inverter limits, reserve margins, temperature control, and expected degradation. Small details matter. Heat inside a container can affect output, while holding too much reserve can leave less energy for daily dispatch.
Comparing system designs against the 2.1-hour average highlights different priorities. Shorter-duration systems may suit fast response and frequent cycling. Longer-duration designs require more cells, space, and careful thermal management. They can cover extended demand peaks, but added capacity costs more and may sit unused on mild days. Not always. Project teams should test hourly load data, charging access, and local operating patterns before selecting a duration. Reported averages also depend on how projects are counted, so the 2.1-hour figure should be treated as a benchmark, not a precise specification for every installation.
| Normalized System Design | Discharge Duration | Energy at 100 MW | Difference from 2.1-Hour Reference | Relative to Reference |
|---|---|---|---|---|
| Short-duration design scenario | 1.0 hours | 100 MWh | −1.1 hours | 52.4% shorter |
| Two-hour design scenario | 2.0 hours | 200 MWh | −0.1 hours | 4.8% shorter |
| 2023 average reference stated in the title | 2.1 hours | 210 MWh | Baseline | Reference point |
| Extended-duration design scenario | 4.0 hours | 400 MWh | +1.9 hours | 90.5% longer |
| Long-duration design scenario | 6.0 hours | 600 MWh | +3.9 hours | 185.7% longer |
| Eight-hour design scenario | 8.0 hours | 800 MWh | +5.9 hours | 281.0% longer |
Values are normalized calculations, not manufacturer-specific product specifications. Energy is calculated as rated power multiplied by discharge duration (MWh = MW × hours), using a constant 100 MW power rating. The 2.1-hour figure is treated as the reference stated in the title; no company or brand data is presented.
How to Assess Manufacturers by Cells, Power Conversion, Safety, and Scale
Compare manufacturers through evidence, not brochure claims. Ask for cell-level capacity retention data across real operating temperatures, cycling depth, and warranty conditions. The IEA’s Batteries and Secure Energy Transitions (2024) reports lithium-ion battery prices fell about 90% between 2010 and 2023. Lower prices matter, but cell quality and replacement planning still shape lifetime cost. Check whether quoted efficiency covers the complete system, including power conversion, cooling, and auxiliary loads.
The power conversion system (PCS) should match the site’s grid requirements and ramping needs. Request third-party test results for response time, efficiency, and performance at partial load. Review system safety evidence, including thermal-runaway testing, fire detection, and clear emergency procedures. The IEA estimates battery storage capacity must reach around 1,200 GW by 2030 in its net-zero pathway. That scale makes manufacturing capacity and traceable quality controls important. A large factory is not proof of consistent field performance.
Tips: Ask for operating data from comparable projects, not just a single showcase site. Verify production capacity, component sourcing, service response times, and spare-part availability. A spreadsheet can still flatter a weak design; some assumptions deserve a second look.