Top Battery Storage Systems for Global Buyers

Global buyers are evaluating battery storage against a rapidly changing energy market. The International Energy Agency’s Batteries and Secure Energy Transitions report (2024) says global battery storage capacity must expand sixfold, reaching 1,500 GW by 2030, in its Net Zero Emissions scenario. That growth reflects rising demand for flexible power as wind and solar become larger parts of electricity systems. Scale matters.

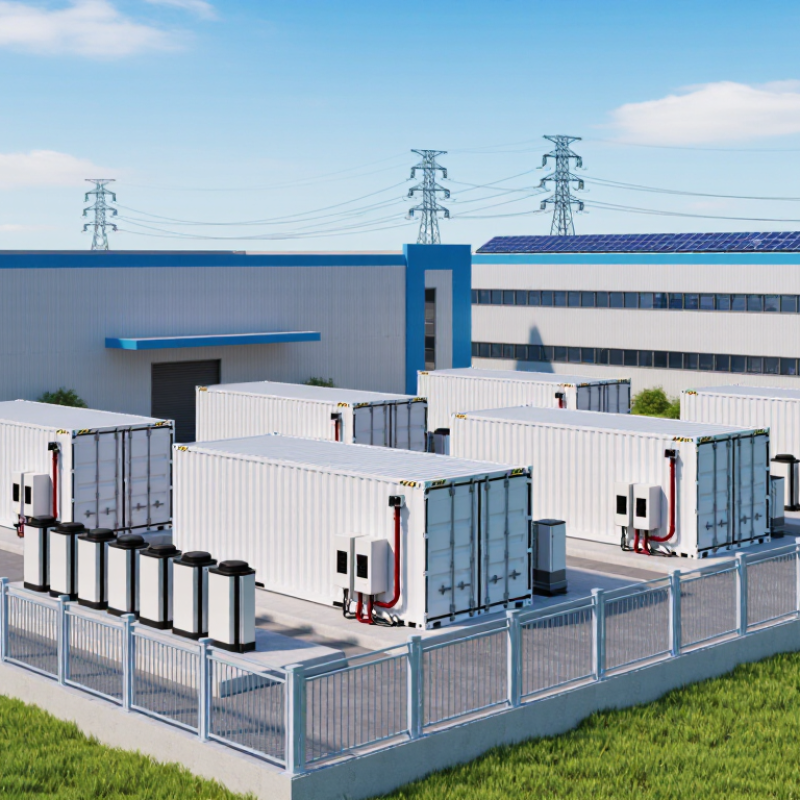
But a headline capacity figure cannot tell buyers which system will perform best at a particular site. A container beside a factory, for example, must work with local grid conditions, inverters, cooling equipment, and the operator’s daily load profile. Buyers should compare usable energy, round-trip efficiency, degradation assumptions, warranties, safety provisions, and long-term service support—not just the quoted price per kilowatt-hour. These details are easy to overlook.

IEA Executive Director Fatih Birol has described batteries as “a key technology for clean energy transitions.” The agency’s analysis gives buyers a useful market reference, but forecasts are not guarantees. Actual project economics depend on installation costs, electricity prices, operating strategy, and access to maintenance. Even strong specifications need scrutiny: warranty exclusions and unclear performance assumptions can change the real value of a system. That is worth remembering.

This guide compares leading battery storage systems for global buyers, focusing on practical selection criteria, supplier capabilities, and trade-offs. No single product fits every market. The right choice depends on where it will operate, how it will be used, and who will support it years later.
Top Battery Storage Systems for Global Buyers

Battery Storage System Types: Lithium-Ion, Sodium-Ion, and Flow Batteries

Top Battery Storage Systems for Global Buyers

Battery Storage System Types: Lithium-Ion, Sodium-Ion, and Flow Batteries

Lithium-ion systems suit sites needing compact storage, fast response, and established supply chains. The International Energy Agency reported that lithium-ion battery prices fell about 90% between 2010 and 2023, reaching roughly USD 140 per kilowatt-hour. That trend helps, but project costs also depend on inverters, installation, cooling, and operating conditions. A battery room still needs careful thermal and fire-safety planning.

Sodium-ion batteries use more widely available materials and may reduce exposure to lithium supply constraints. The IEA’s 2024 battery analysis describes them as a potential alternative, while noting their lower energy density than lithium-ion. In practice, that can mean a larger footprint for the same stored energy. Space matters. Buyers should check real system-level performance, not just cell claims.

Flow batteries store energy in liquid electrolytes held in external tanks, allowing power and energy capacity to be sized more independently. The U.S. Department of Energy’s 2022 Grid Energy Storage Technology Cost and Performance Assessment examines flow batteries among long-duration storage options. They may suit projects with long discharge needs and available land, though their systems can be physically larger. I would not choose by chemistry label alone. Compare duration, cycle life, site conditions, service access, and verified performance data; no technology wins every duty cycle.

Global Market Baseline: 42 GW of Grid-Scale Battery Additions in 2023 (IEA)

The IEA’s reported 42 GW of grid-scale battery additions in 2023 offers a useful market baseline. It signals rapid deployment, but installed power alone does not show how much energy a system can deliver. Buyers should compare both gigawatts and gigawatt-hours, then check the expected discharge duration.

For example, a 100 MW system with 400 MWh of usable capacity can deliver full power for about four hours under stated conditions. Actual performance depends on operating limits, temperature, degradation, and auxiliary loads. Small details matter. A project designed for frequent short cycles may not suit a grid needing longer evening coverage.

The headline figure is encouraging, but it can make the market look simpler than it is. That distinction is easy to miss, even in experienced procurement teams. Compare round-trip efficiency, warranted capacity retention, response time, safety provisions, and service support using consistent test conditions. Ask how usable capacity changes over time, not just what a system offers at commissioning. Grid connection schedules and local operating requirements can also shape project value. A large addition figure does not guarantee that every proposed system will perform well in a specific location.

Top Battery Storage Systems for Global Buyers — Global Market Baseline: 42 GW of Grid-Scale Battery Additions in 2023 (IEA)
System Type How It Stores Energy Key Characteristics Common Buyer Fit Procurement Considerations
Global market baseline: The International Energy Agency (IEA) reports that worldwide grid-scale battery storage additions reached approximately 42 GW in 2023, about twice the 2022 level. This is annual added power capacity, not total installed capacity.
Lithium-ion — LFP
Lithium iron phosphate
Stores and releases energy through lithium-ion movement between electrodes. Widely used in stationary storage. LFP avoids nickel and cobalt in its cathode chemistry and is commonly selected for its thermal stability and cycle-life characteristics. Grid-scale projects, renewable-energy shifting, and commercial or industrial storage where a mature supply chain is important. Review usable capacity, cycle-life warranty, operating temperature limits, fire-safety design, degradation assumptions, and recycling arrangements.
Lithium-ion — NMC
Nickel manganese cobalt
Uses a lithium-ion cell with a cathode containing nickel, manganese, and cobalt. Typically offers higher cell-level energy density than LFP. The specific balance of performance, cost, and safety depends on cell design and system engineering. Projects where compact equipment footprint or high energy density is a priority. Assess the full system’s safety controls, thermal management, warranty terms, material sourcing, and end-of-life plan—not chemistry alone.
Sodium-ion Moves sodium ions between electrodes to charge and discharge the cell. Uses sodium rather than lithium and may diversify battery-material supply options. Commercial availability and product maturity vary by supplier and market. Buyers considering emerging alternatives or seeking to broaden technology and supply-chain options. Check independently verified performance data, project references, warranty coverage, bankability, and local service capability.
Vanadium redox flow Stores energy in liquid electrolytes held in tanks and circulated through a cell stack. Energy capacity and power output can be scaled separately by changing tank and stack sizing. The system generally requires more physical space than battery systems with higher energy density. Stationary applications that value long-duration operation and flexible separation of power and energy capacity. Evaluate site footprint, auxiliary energy use, electrolyte management, project-specific efficiency, and the supplier’s long-term service plan.
Lead-acid Uses lead-based electrodes and a sulfuric-acid electrolyte. A mature, widely recyclable battery chemistry, but generally has lower energy density and shorter cycle life than modern lithium-ion options. Some backup-power and cost-sensitive applications with suitable maintenance and replacement plans. Compare lifetime cost rather than purchase price alone; account for replacement frequency, maintenance, ventilation, and recycling logistics.
System-level checks for every chemistry Compare complete, usable system performance—not cell specifications alone. Review AC round-trip efficiency, power and energy ratings, operating duration, degradation, availability guarantees, controls and grid-code compliance, safety certifications, installation scope, warranty exclusions, service response, and end-of-life responsibilities.
Source and scope Market baseline: IEA, Batteries and Secure Energy Transitions (2024), reporting approximately 42 GW of grid-scale battery additions worldwide in 2023. Technology descriptions are general comparisons; actual system performance and suitability depend on product design, project conditions, and local regulations.

Cost Benchmark: Lithium-Ion Pack Prices Averaged $115/kWh in 2024 (BloombergNEF)

In 2024, average lithium-ion battery pack prices were reported at $115 per kilowatt-hour. That figure is a useful benchmark, not a turnkey system quote. It covers the battery pack, while a project may also require inverters, controls, thermal management, installation, shipping, and commissioning. At that average, a 10 kWh pack would cost about $1,150 before those additions. Simple arithmetic. Actual quotes can differ substantially.

Tips: Compare offers using the same usable capacity, warranty period, power rating, and delivery scope. Ask whether the price includes battery management hardware, enclosure, and commissioning. Check cycle-life assumptions and usable-depth limits; a lower price per kWh may mean less usable energy over time. Request an itemized estimate, and confirm its currency, delivery location, and date.

Pack prices shift with material costs, factory output, order size, and regional logistics. They also reveal little about performance in a hot garage or during frequent high-power cycling. Treat $115/kWh as a comparison anchor, then check it against current supplier quotes and complete project costs. Prices vary. Headline averages may hide differences in chemistry and pack configuration, so the benchmark is helpful but incomplete.

Performance Metrics: Compare Efficiency, Duration, Cycle Life, and Power Rating

For global buyers, headline efficiency figures are useful only when their boundaries are clear. Ask whether the number measures AC-to-AC or DC-to-DC performance, and whether it includes cooling and conversion losses. A system reporting 95 percent efficiency on one basis may deliver less at the site meter. Check the test conditions.

Duration describes how long storage can sustain a stated output, not simply the size of its energy reserve. A 1 MW system with 4 MWh of usable energy can provide four hours at that output, before accounting for operating limits. That matters. Compare usable energy at the planned discharge rate, and check whether the rating changes with temperature or state of charge.

Cycle life needs context: request the tested depth of discharge, operating temperature, and capacity remaining at the stated cycle count. A large cycle figure without those details is hard to compare. Power rating also has two sides: continuous output and short-duration peak output. Confirm both against the site’s loads and grid connection. I would not treat a single datasheet value as a guarantee; field conditions rarely match a neat laboratory profile. Test the details. Ask for independently documented test methods and performance assumptions, then record any gaps before comparing bids.

Top Battery Storage Systems for Global Buyers

Performance Metrics: Compare Efficiency, Duration, Cycle Life, and Power Rating

Each bubble represents an indicative technology-level benchmark: horizontal position shows round-trip efficiency, vertical position shows discharge duration, and bubble size indicates cycle life. Values are representative ranges, not product guarantees. Power rating is project-configurable rather than an intrinsic technology limit; utility-scale installations can range from MW-scale to 100+ MW projects.

Buyer Checklist: Match Capacity, Safety Standards, and Grid Requirements to Use Case

Choosing a storage system starts with the job it must perform. A home backup may need to run a refrigerator, lights, and a medical device overnight. A workshop may instead need steady power for motors during peak demand. List essential loads, their starting surges, and expected outage duration before comparing capacity. Measure twice.

Check usable energy in kilowatt-hours, not just the headline capacity. Also compare continuous and peak power ratings; a large battery may still struggle with equipment that draws a brief, heavy surge. Match the system’s chemistry, enclosure, and thermal controls to its installation environment. Safety documentation should identify relevant testing and certification for the destination market. Requirements vary, so confirm them with a qualified installer and local authorities. Details matter.

Grid requirements shape the choice too. Confirm voltage, phase, frequency, export limits, and whether the system needs backup isolation during an outage. Ask how the inverter communicates with the meter or energy-management equipment. For off-grid sites, assess charging sources and several low-sun days, not just an average day. Early load estimates are often imperfect; revise them after reviewing actual bills or measuring equipment. A realistic margin helps, but excessive capacity can add cost without improving reliability.